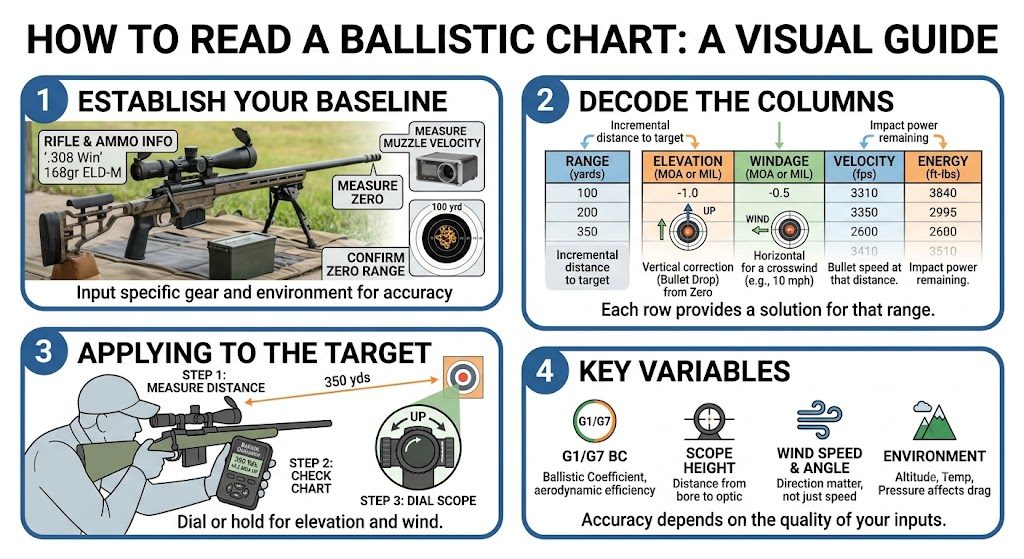
For long-range shooters, hunters, and firearms enthusiasts, a ballistic chart (or data card/DOPE card) is the ultimate cheat sheet. It bridges the gap between guessing where your bullet will land and predictably hitting a bullseye at hundreds of yards.
While a grid full of numbers can look intimidating at first glance, reading a ballistic chart is incredibly straightforward once you understand what each column represents. Here is a logical, step-by-step breakdown of how to read, interpret, and apply a ballistic chart.
Table of Contents [Click to open]
1. The Foundation: Input Data (The “Why”)
Before diving into the columns, you must look at the header info. A ballistic chart is only valid for a specific set of variables. If you change your ammunition or rifle, the entire chart changes.
Make sure your chart matches your exact setup:
- Bullet Weight & Type: (e.g., 143-grain Hornady ELD-X)
- Muzzle Velocity: The speed of the bullet as it leaves the barrel (e.g., 2,700 fps).
- Sight Height: The distance between the center of your scope and the center of your bore.
- Zero Range: The distance at which your rifle is perfectly sighted in (usually 100 yards).
2. Anatomy of a Ballistic Chart (The “What”)
A standard ballistic table is organized by distance (rows) and behavioral metrics (columns). Here are the core columns you will encounter:
| Range (Yds) | Drop (Inches) | Drop (MOA) | Drop (MIL/MRAD) | Windage (10mph / MOA) | Velocity (FPS) | Energy (Ft-Lbs) | Time (Sec) |
| 100 | 0.0 | 0.0 | 0.0 | 0.4 | 2540 | 2045 | 0.11 |
| 200 | -3.8 | -1.8 | -0.5 | 0.9 | 2385 | 1805 | 0.23 |
| 300 | -13.5 | -4.3 | -1.3 | 1.5 | 2235 | 1585 | 0.36 |
| 400 | -29.8 | -7.1 | -2.1 | 2.1 | 2090 | 1385 | 0.50 |
| 500 | -53.4 | -10.2 | -3.0 | 2.8 | 1950 | 1205 | 0.65 |
Column Breakdown:
- Range: The distance from your rifle to the target, usually measured in 25 or 50-yard increments.
- Drop (Inches/CM): The actual physical distance the bullet has fallen below your line of sight due to gravity.
- Drop (MOA or MIL): This is your correction column. Instead of physical inches, this tells you how many clicks to adjust your scope turret (or where to hold over on your reticle).
- Windage: The amount a crosswind (usually standardized to a 10 mph wind) will push your bullet sideways. Like drop, this is given in MOA or MILs.
- Velocity & Energy: Tells you how fast the bullet is traveling and how much hitting power it retains at that specific distance (crucial for ethical hunting).
- Time of Flight: How many seconds it takes for the bullet to reach the target.
3. How to Use the Chart in the Field (The “How”)
When you are out in the field or at the range, using the chart boils down to a simple 4-step process:
Step 1: Range the Target
Use a laser rangefinder to get the exact distance to your target. Let’s say your target is exactly 400 yards away.
Step 2: Look up your Elevation Drop
Find “400” under the Range column. Move horizontally across to find your drop.
- If your scope uses MOA, the chart says -7.1 MOA.
- If you are dialing your scope turret, you will turn it up 7.1 MOA (or roughly 28 clicks on a standard 1/4 MOA scope). If you prefer to “hold over” using your scope’s reticle, you will use the 7.1 mark below the crosshairs.
Step 3: Adjust for Wind
Look at the Windage column at 400 yards. The chart shows 2.1 MOA for a 10 mph wind.
- If the wind is a steady 10 mph from the left: Dial or hold 2.1 MOA to the left to counteract the drift.
- If the wind is only 5 mph: Cut that number in half (~1 MOA).
Step 4: Send It
With your scope dialed or your reticle precisely aligned according to those numbers, break a clean shot.
4. Key Takeaways for Success
- MOA vs. MIL: Make sure your chart matches your scope! If your scope turrets say “1 click = 1/4 MOA,” use an MOA chart. If they say “1 click = 0.1 MRAD,” use a MIL chart.
- The Crucial Velocity Check: Keep an eye on your velocity column. When a bullet drops below the speed of sound (approx. 1,125 fps), it enters the “transonic zone,” where it can become unstable and unpredictable.
- Environmental Factors: Bullet drop changes with temperature, altitude, and barometric pressure. A chart generated for a hot summer day in the mountains of Colorado won’t be perfectly accurate for a freezing winter day at sea level in Texas.
By understanding how to read these columns, you transform ballistics from a guessing game into a predictable science. Print out your chart, laminate it, tape it to your rifle stock, and enjoy the confidence of knowing exactly where your bullet is going to land.