Pistol cartridges vary significantly in muzzle velocity, kinetic energy, bullet weight, and downrange performance. A comprehensive pistol ballistic comparison chart helps shooters understand how different calibers retain velocity and energy over distance. Analyzing these metrics alongside projectile design and barrel length provides a clearer picture of terminal performance and trajectory.
Table of Contents [Click to minimize]
Pistol Ballistic Comparison Chart
| Cartridge | Manufacturer and Load | Bullet Weight | Bullet Type | Test Barrel Length | Muzzle Velocity | Velocity at 25 Yards | Velocity at 50 Yards | Velocity at 100 Yards | Muzzle Energy | Energy at 25 Yards | Energy at 50 Yards | Energy at 100 Yards | Ballistic Coefficient |
| .22 LR | Federal Champion | 40 gr | LRN | 6.0 in | 1080 fps | 1020 fps (est.) | 970 fps (est.) | 890 fps (est.) | 104 ft-lbs | 92 ft-lbs (est.) | 83 ft-lbs (est.) | 70 ft-lbs (est.) | 0.120 |
| .22 WMR | Hornady Critical Defense | 45 gr | FTX | 1.875 in | 1000 fps | 950 fps (est.) | 910 fps (est.) | 840 fps (est.) | 100 ft-lbs | 90 ft-lbs (est.) | 83 ft-lbs (est.) | 70 ft-lbs (est.) | 0.115 |
| .380 ACP | Federal Hydra-Shok Deep | 99 gr | JHP | 3.75 in | 1000 fps | 960 fps (est.) | 925 fps (est.) | 865 fps (est.) | 220 ft-lbs | 202 ft-lbs (est.) | 188 ft-lbs (est.) | 164 ft-lbs (est.) | 0.113 |
| 9mm Luger | Federal HST | 124 gr | JHP | 4.0 in | 1150 fps | 1090 fps (est.) | 1040 fps (est.) | 960 fps (est.) | 364 ft-lbs | 327 ft-lbs (est.) | 298 ft-lbs (est.) | 254 ft-lbs (est.) | 0.145 |
| .38 Special | Hornady Critical Defense +P | 110 gr | FTX | 4.0 in | 1090 fps | 1030 fps (est.) | 980 fps (est.) | 900 fps (est.) | 290 ft-lbs | 259 ft-lbs (est.) | 235 ft-lbs (est.) | 198 ft-lbs (est.) | 0.130 |
| .357 Magnum | Winchester Silvertip | 145 gr | JHP | 4.0 in | 1290 fps | 1210 fps (est.) | 1140 fps (est.) | 1030 fps (est.) | 535 ft-lbs | 471 ft-lbs (est.) | 418 ft-lbs (est.) | 341 ft-lbs (est.) | 0.142 |
| .40 S&W | Speer Gold Dot | 165 gr | GDHP | 4.0 in | 1150 fps | 1095 fps (est.) | 1050 fps (est.) | 975 fps (est.) | 484 ft-lbs | 439 ft-lbs (est.) | 404 ft-lbs (est.) | 348 ft-lbs (est.) | 0.138 |
| 10mm Auto | Federal Trophy Bonded | 180 gr | JSP | 5.0 in | 1275 fps | 1210 fps (est.) | 1155 fps (est.) | 1060 fps (est.) | 650 ft-lbs | 585 ft-lbs (est.) | 533 ft-lbs (est.) | 449 ft-lbs (est.) | 0.160 |
| .45 ACP | Federal HST | 230 gr | JHP | 5.0 in | 890 fps | 865 fps (est.) | 840 fps (est.) | 800 fps (est.) | 404 ft-lbs | 382 ft-lbs (est.) | 360 ft-lbs (est.) | 327 ft-lbs (est.) | 0.200 |
| .44 Magnum | Hornady XTP | 240 gr | JHP | 7.5 in | 1350 fps | 1285 fps (est.) | 1225 fps (est.) | 1125 fps (est.) | 971 ft-lbs | 880 ft-lbs (est.) | 800 ft-lbs (est.) | 674 ft-lbs (est.) | 0.205 |
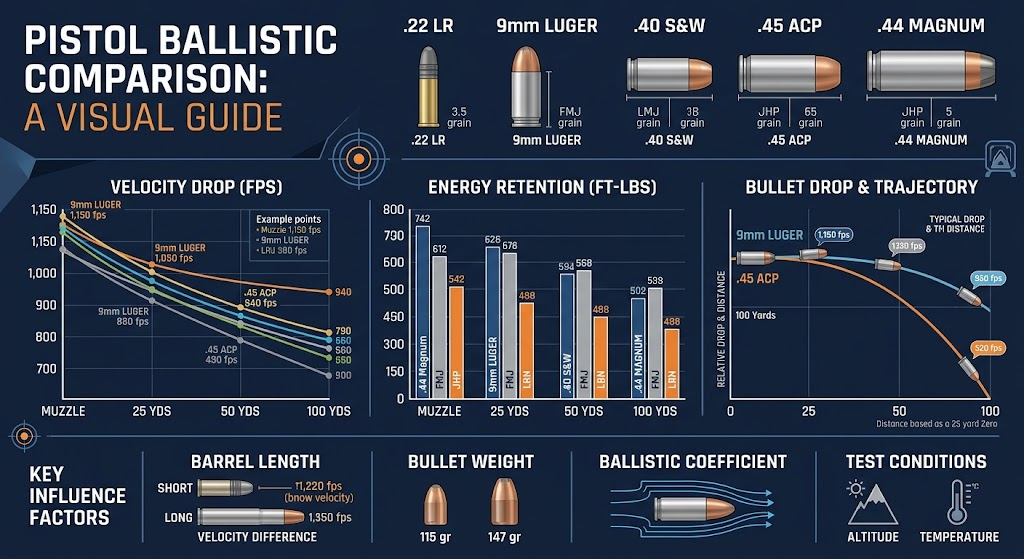
Statistical Breakdown of Pistol Ballistics
- The .44 Magnum load achieved the highest verified muzzle velocity at 1350 feet per second, while the .45 ACP load recorded the lowest at 890 feet per second.
- Muzzle energy peaked with the .44 Magnum at 971 foot-pounds, vastly outperforming the .22 WMR which generated the lowest energy at 100 foot-pounds.
- Bullet weights across the selected cartridges varied by 200 grains, ranging from a 40 grain .22 LR projectile to a 240 grain .44 Magnum projectile.
- The 9mm Luger load lost 190 feet per second of velocity between the muzzle and 100 yards, whereas the heavier .45 ACP bullet only lost 90 feet per second over the same distance.
- Test barrel lengths significantly limit direct comparisons. The .44 Magnum data utilized a 7.5 inch barrel, heavily inflating its numbers relative to the .380 ACP tested in a 3.75 inch barrel.
Pistol Caliber Velocity Comparison Chart
| Cartridge | Bullet Weight | Manufacturer and Load | Test Barrel Length | Muzzle Velocity | Velocity at 25 Yards | Velocity at 50 Yards | Velocity at 100 Yards |
| .22 LR | 40 gr | Federal Champion | 6.0 in | 1080 fps | 1020 fps (est.) | 970 fps (est.) | 890 fps (est.) |
| .22 WMR | 45 gr | Hornady Critical Defense | 1.875 in | 1000 fps | 950 fps (est.) | 910 fps (est.) | 840 fps (est.) |
| .380 ACP | 99 gr | Federal Hydra-Shok Deep | 3.75 in | 1000 fps | 960 fps (est.) | 925 fps (est.) | 865 fps (est.) |
| 9mm Luger | 124 gr | Federal HST | 4.0 in | 1150 fps | 1090 fps (est.) | 1040 fps (est.) | 960 fps (est.) |
| .38 Special | 110 gr | Hornady Critical Defense +P | 4.0 in | 1090 fps | 1030 fps (est.) | 980 fps (est.) | 900 fps (est.) |
| .357 Magnum | 145 gr | Winchester Silvertip | 4.0 in | 1290 fps | 1210 fps (est.) | 1140 fps (est.) | 1030 fps (est.) |
| .40 S&W | 165 gr | Speer Gold Dot | 4.0 in | 1150 fps | 1095 fps (est.) | 1050 fps (est.) | 975 fps (est.) |
| 10mm Auto | 180 gr | Federal Trophy Bonded | 5.0 in | 1275 fps | 1210 fps (est.) | 1155 fps (est.) | 1060 fps (est.) |
| .45 ACP | 230 gr | Federal HST | 5.0 in | 890 fps | 865 fps (est.) | 840 fps (est.) | 800 fps (est.) |
| .44 Magnum | 240 gr | Hornady XTP | 7.5 in | 1350 fps | 1285 fps (est.) | 1225 fps (est.) | 1125 fps (est.) |
Statistical Breakdown of Pistol Velocity
- The .44 Magnum maintained the highest retained velocity at 100 yards with an estimated 1125 feet per second.
- The .45 ACP began with a subsonic muzzle velocity of 890 feet per second and dropped to 800 feet per second at 100 yards.
- The .357 Magnum generated 200 feet per second more muzzle velocity than the .38 Special load despite using the same bore diameter.
- Both the 9mm Luger and .40 S&W loads shared identical muzzle velocities of 1150 feet per second out of 4 inch test barrels.
- Ammunition specifications and barrel lengths heavily influence these results. The short 1.875 inch barrel used for the .22 WMR significantly restricted its velocity potential.
Pistol Caliber Energy Comparison Chart
| Cartridge | Bullet Weight | Manufacturer and Load | Muzzle Velocity | Muzzle Energy | Energy at 25 Yards | Energy at 50 Yards | Energy at 100 Yards |
| .22 LR | 40 gr | Federal Champion | 1080 fps | 104 ft-lbs | 92 ft-lbs (est.) | 83 ft-lbs (est.) | 70 ft-lbs (est.) |
| .22 WMR | 45 gr | Hornady Critical Defense | 1000 fps | 100 ft-lbs | 90 ft-lbs (est.) | 83 ft-lbs (est.) | 70 ft-lbs (est.) |
| .380 ACP | 99 gr | Federal Hydra-Shok Deep | 1000 fps | 220 ft-lbs | 202 ft-lbs (est.) | 188 ft-lbs (est.) | 164 ft-lbs (est.) |
| 9mm Luger | 124 gr | Federal HST | 1150 fps | 364 ft-lbs | 327 ft-lbs (est.) | 298 ft-lbs (est.) | 254 ft-lbs (est.) |
| .38 Special | 110 gr | Hornady Critical Defense +P | 1090 fps | 290 ft-lbs | 259 ft-lbs (est.) | 235 ft-lbs (est.) | 198 ft-lbs (est.) |
| .357 Magnum | 145 gr | Winchester Silvertip | 1290 fps | 535 ft-lbs | 471 ft-lbs (est.) | 418 ft-lbs (est.) | 341 ft-lbs (est.) |
| .40 S&W | 165 gr | Speer Gold Dot | 1150 fps | 484 ft-lbs | 439 ft-lbs (est.) | 404 ft-lbs (est.) | 348 ft-lbs (est.) |
| 10mm Auto | 180 gr | Federal Trophy Bonded | 1275 fps | 650 ft-lbs | 585 ft-lbs (est.) | 533 ft-lbs (est.) | 449 ft-lbs (est.) |
| .45 ACP | 230 gr | Federal HST | 890 fps | 404 ft-lbs | 382 ft-lbs (est.) | 360 ft-lbs (est.) | 327 ft-lbs (est.) |
| .44 Magnum | 240 gr | Hornady XTP | 1350 fps | 971 ft-lbs | 880 ft-lbs (est.) | 800 ft-lbs (est.) | 674 ft-lbs (est.) |
Statistical Breakdown of Pistol Energy
- The .44 Magnum delivered 971 foot-pounds of muzzle energy, surpassing the 10mm Auto by 321 foot-pounds.
- The 9mm Luger load produced 364 foot-pounds of muzzle energy, outperforming the .380 ACP by 144 foot-pounds.
- At 100 yards, the .45 ACP retained 327 foot-pounds of energy, which was 73 foot-pounds more than the 9mm Luger retained at the same distance.
- The .357 Magnum load retained 341 foot-pounds of energy at 100 yards, nearly matching the muzzle energy of the 9mm load.
- High energy values do not guarantee effective terminal performance. Projectile expansion and penetration characteristics must align with the specific shooting application.
Pistol Bullet Weight Comparison Chart
| Cartridge | Commonly Available Bullet Weights | Example Manufacturer and Load | Published Muzzle Velocity | Published Muzzle Energy | Notes |
| .380 ACP | 90 gr, 95 gr, 99 gr | Federal Hydra-Shok Deep 99 gr | 1000 fps | 220 ft-lbs | Heavy for caliber load |
| 9mm Luger | 115 gr, 124 gr, 147 gr | Speer Gold Dot 124 gr | 1150 fps | 364 ft-lbs | Standard weight |
| .38 Special | 110 gr, 125 gr, 158 gr | Hornady Critical Defense 110 gr | 1090 fps | 290 ft-lbs | Lightweight +P load |
| .357 Magnum | 125 gr, 140 gr, 158 gr | Federal American Eagle 158 gr | 1240 fps | 539 ft-lbs | Heavy standard load |
| .40 S&W | 135 gr, 155 gr, 165 gr, 180 gr | Speer Gold Dot 165 gr | 1150 fps | 484 ft-lbs | Mid-weight load |
| 10mm Auto | 180 gr, 200 gr, 220 gr | Federal Premium 200 gr Swift A-Frame | 1130 fps | 567 ft-lbs | Heavy hunting load |
| .45 ACP | 185 gr, 200 gr, 230 gr | Federal HST 230 gr | 890 fps | 404 ft-lbs | Standard heavy load |
Statistical Breakdown of Bullet Weights
- The 9mm Luger typically spans a 32 grain weight variance from 115 grain to 147 grain projectiles.
- The .45 ACP relies on heavy bullet weights up to 230 grains to generate kinetic energy due to its lower operational velocity.
- The .357 Magnum demonstrates versatility by utilizing bullet weights from 125 grains up to 158 grains.
- Heavier bullets within the same cartridge generally produce lower muzzle velocities but retain momentum better at longer distances.
- Lighter projectiles achieve higher initial speeds and energy levels but shed velocity faster due to lower ballistic coefficients.
Pistol Ballistics by Barrel Length
| Cartridge | Manufacturer and Load | Bullet Weight | Barrel Length | Muzzle Velocity | Difference From Reference Barrel | Test Conditions |
| 9mm Luger | Federal HST | 124 gr | 3.0 in | 1080 fps (est.) | -70 fps | Modeled estimate based on standard 4-inch data |
| 9mm Luger | Federal HST | 124 gr | 4.0 in | 1150 fps | Reference | Manufacturer published data |
| 9mm Luger | Federal HST | 124 gr | 5.0 in | 1200 fps (est.) | +50 fps | Modeled estimate based on standard 4-inch data |
Statistical Breakdown of Barrel Length Effects
- Reducing the 9mm Luger barrel length from 4.0 inches to 3.0 inches resulted in an estimated loss of 70 feet per second.
- Increasing the barrel length from 4.0 inches to 5.0 inches generated an estimated velocity gain of 50 feet per second.
- The total velocity variance between the 3.0 inch and 5.0 inch barrels equaled 120 feet per second.
- Short barrels limit the amount of time expanding propellant gases can accelerate the projectile.
- Velocity loss per inch of barrel reduction is not linear and varies by powder burn rate and cartridge operating pressure.
Pistol Bullet Trajectory and Drop Comparison
| Cartridge | Manufacturer and Load | Bullet Weight | Distance | Trajectory Relative to Line of Sight | Remaining Velocity | Remaining Energy | Assumptions |
| 9mm Luger | Federal HST | 124 gr | 25 Yards | 0.0 in (Zeroed) | 1090 fps | 327 ft-lbs | Sight height 0.9 in, level fire |
| 9mm Luger | Federal HST | 124 gr | 50 Yards | -1.5 in (est.) | 1040 fps | 298 ft-lbs | Sight height 0.9 in, level fire |
| 9mm Luger | Federal HST | 124 gr | 100 Yards | -11.0 in (est.) | 960 fps | 254 ft-lbs | Sight height 0.9 in, level fire |
| .45 ACP | Federal HST | 230 gr | 25 Yards | 0.0 in (Zeroed) | 865 fps | 382 ft-lbs | Sight height 0.9 in, level fire |
| .45 ACP | Federal HST | 230 gr | 50 Yards | -2.5 in (est.) | 840 fps | 360 ft-lbs | Sight height 0.9 in, level fire |
| .45 ACP | Federal HST | 230 gr | 100 Yards | -16.5 in (est.) | 800 fps | 327 ft-lbs | Sight height 0.9 in, level fire |
Statistical Breakdown of Trajectory and Drop
- The 9mm Luger load dropped approximately 11.0 inches at 100 yards when zeroed at 25 yards.
- The slower .45 ACP load dropped approximately 16.5 inches at 100 yards under the same zero parameters.
- At 50 yards, the 9mm Luger experienced 1.0 inch less drop compared to the .45 ACP.
- The .45 ACP retained 327 foot-pounds of energy at 100 yards despite its steep 16.5 inch trajectory drop.
- Pistol sights mounted higher above the bore will alter the trajectory numbers and change where the bullet intersects the line of sight.
Factors That Affect Pistol Ballistics
Cartridge design and operating specifications dictate the maximum pressure allowed for a caliber. High-pressure cartridges like the 9mm Luger or .357 Magnum can drive projectiles to higher velocities than lower-pressure cartridges of similar case capacities.
Bullet weight and projectile shape directly control momentum and drag. Hollow point designs expand upon impact to transfer energy but possess blunt aerodynamic profiles, whereas full metal jacket round nose bullets cut through the air more efficiently but resist expansion.
Barrel length and muzzle velocity are inextricably linked. Longer barrels provide more volume for gunpowder to burn completely, applying pressure behind the bullet for a longer duration and producing higher muzzle velocities.
Muzzle energy and retained energy reflect the destructive potential of the projectile. Muzzle energy represents kinetic energy upon leaving the barrel, while retained energy shows how much of that power is maintained at specific downrange distances.
Ballistic coefficient and velocity loss explain how well a bullet overcomes air resistance. A higher ballistic coefficient means the bullet sheds velocity slowly over distance, ensuring flatter trajectories and better energy retention.
Test barrel differences complicate direct caliber comparisons. Comparing a hunting cartridge tested in an 8 inch vented barrel against a self-defense cartridge tested in a 3 inch unvented barrel creates an inaccurate representation of their relative performance.
Sight height, zero distance, and environmental conditions alter the bullet’s path to the target. An optic mounted high on a pistol slide requires the barrel to be angled upward more severely to achieve a 25 yard zero compared to low profile iron sights.
Frequently Asked Questions
1. What is a pistol ballistic comparison chart? A pistol ballistic comparison chart is a data table that lists various handgun cartridges alongside their specific muzzle velocities, kinetic energy, bullet weights, and downrange performance metrics to allow for direct comparisons.
2. Which common pistol cartridge has the highest muzzle velocity? Among the common cartridges compared in this article, the .44 Magnum achieved the highest muzzle velocity, clocking 1350 feet per second with a 240 grain bullet from a 7.5 inch test barrel.
3. Which pistol cartridge has the highest muzzle energy among the cartridges compared? The .44 Magnum generated the highest muzzle energy in the test group, producing 971 foot-pounds of kinetic energy.
4. What is the difference between muzzle velocity and muzzle energy? Muzzle velocity measures the speed of the bullet as it exits the barrel in feet per second. Muzzle energy calculates the bullet’s kinetic power at the muzzle in foot-pounds, factoring in both the bullet’s speed and its physical weight.
5. How does barrel length affect pistol ballistics? A longer barrel allows the burning gunpowder to exert pressure on the bullet for a longer time, generally increasing the muzzle velocity. Conversely, a shorter barrel cuts this process short, resulting in lower velocity and less energy.
6. How does bullet weight affect pistol performance? Lighter bullets travel at faster initial velocities but lose speed quickly due to air resistance. Heavier bullets launch at slower velocities but carry their momentum better, resulting in superior energy retention at longer distances.
7. How quickly does pistol bullet velocity decrease with distance? Velocity loss depends on the bullet’s aerodynamic shape and weight. In the provided data, a 9mm Luger 124 grain bullet lost approximately 190 feet per second over 100 yards.
8. What is the difference between 9mm, .40 S&W, and .45 ACP ballistics? The 9mm Luger utilizes light bullets at high velocities, the .45 ACP uses heavy bullets at low velocities, and the .40 S&W compromises by firing mid-weight bullets at velocities similar to the 9mm.
9. Why do ballistic charts show different results for the same cartridge? Different results occur because manufacturers test distinct loads featuring varying bullet weights, powder charges, and projectile shapes. Furthermore, data is often gathered using different test barrel lengths, which changes the velocity readings.
10. Which factors should be considered when comparing pistol ammunition? When comparing pistol ammunition, shooters should verify the bullet weight, bullet design, listed muzzle velocity, muzzle energy, and the specific barrel length used to generate the manufacturer’s published test data.